Biking transportation planning tools
Unique biking ridership and road safety data to inform your decisions, make the case, and evaluate your impact
Data to help inform your
decision-making process
We can provide you with unique data, including:
- Where people are riding bikes for short transportation trips
- How safe/comfortable people feel on different parts of your transportation network
- Specific location based road incident and near-miss data
- Origin/destination information to bring to common biking pattens to life (coming soon)
We provide live ridership data from a diverse range of everyday bike riders
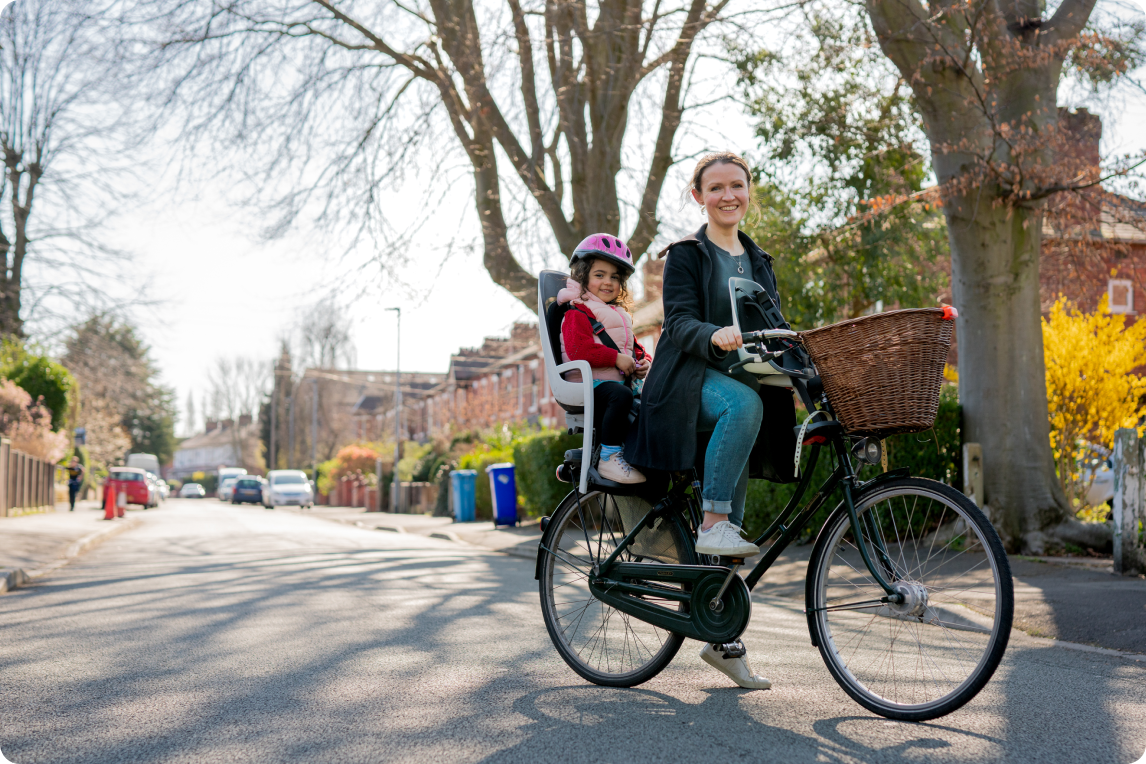
We can help you get the short bike trip data commonly missing from bicycling datasets. Plus, Love to Ride biking data tends to be broad demographic and less-athletic riders.
- 48% of Love to Ride users are female
- Automatic bike trip logging captures short trips
- We actively seek out less-athletic riders
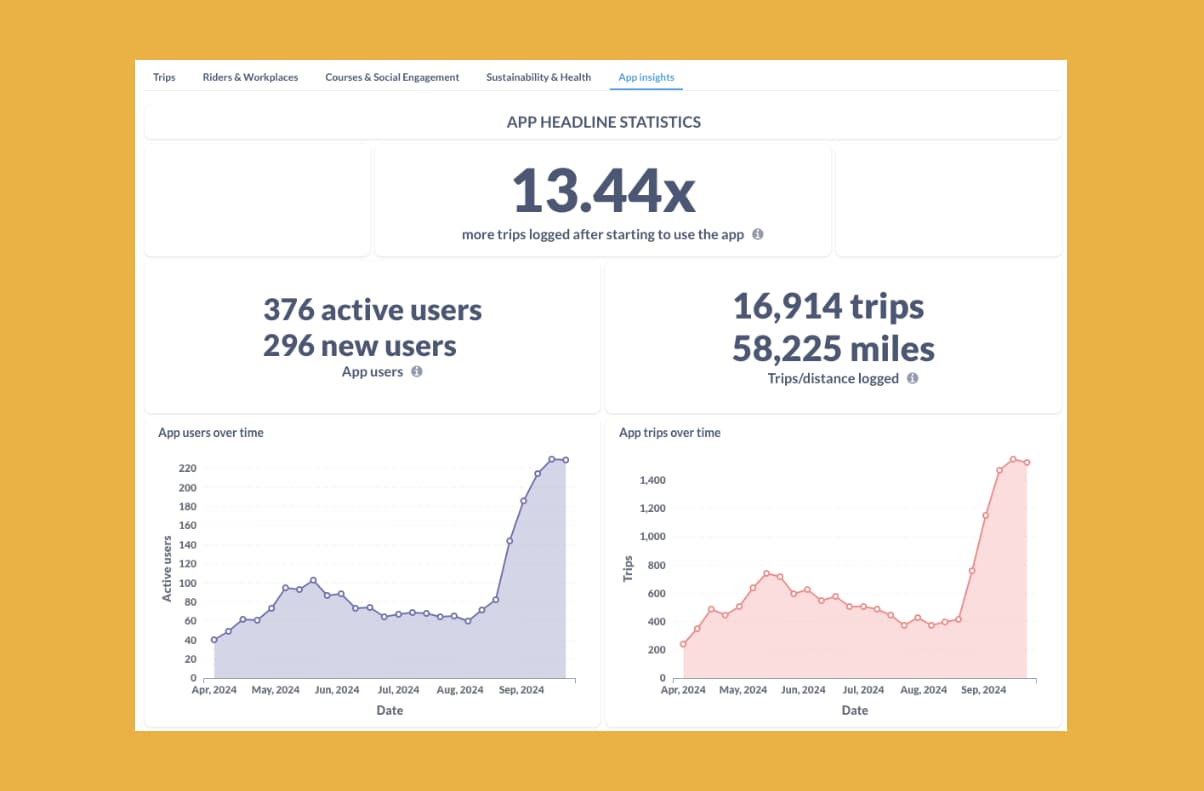
Capturing over 9x more ride data on average
The Love to Ride app automatically records all bike rides - long and short.
The app uses machine learning to identify what mode someone is using to get from A to B. If the app determines they’re riding a bike, it turns on the GPS and records their route.
This auto logging means we record all the biking someone is doing, not just the longer recreational rides that some people record on apps such as Strava.
* On average, our users log 9.3x more bike trips with our app than they did before they downloaded the app - data from Oct 2024.
Making it easy to crowdsource unique planning data
The Love to Ride app has a ‘Rate My Routes’ feature, enabling people to provide feedback on the streets they’ve ridden on.
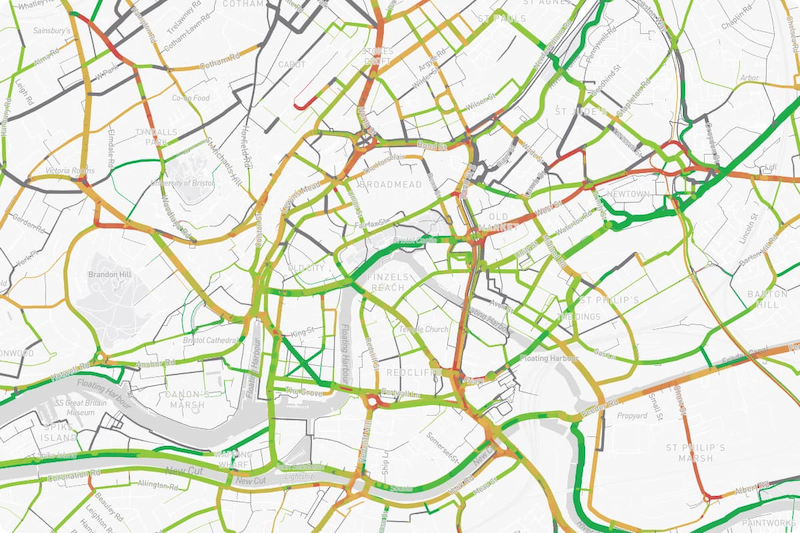
With a simple swipe, riders “paint” sections of the road network to indicate their comfort levels—green for safe and comfortable, red for unsafe or uncomfortable.
There are 4 levels of rating people can give, which are similar to the 4 levels of traffic stress (LTS). This provides detailed LTS maps that are based on the real-world experience that people have when riding on your local road network.
Love to Ride makes it easy and enjoyable to be a citizen scientist, empowering riders to provide useful data to inform local planning decisions.
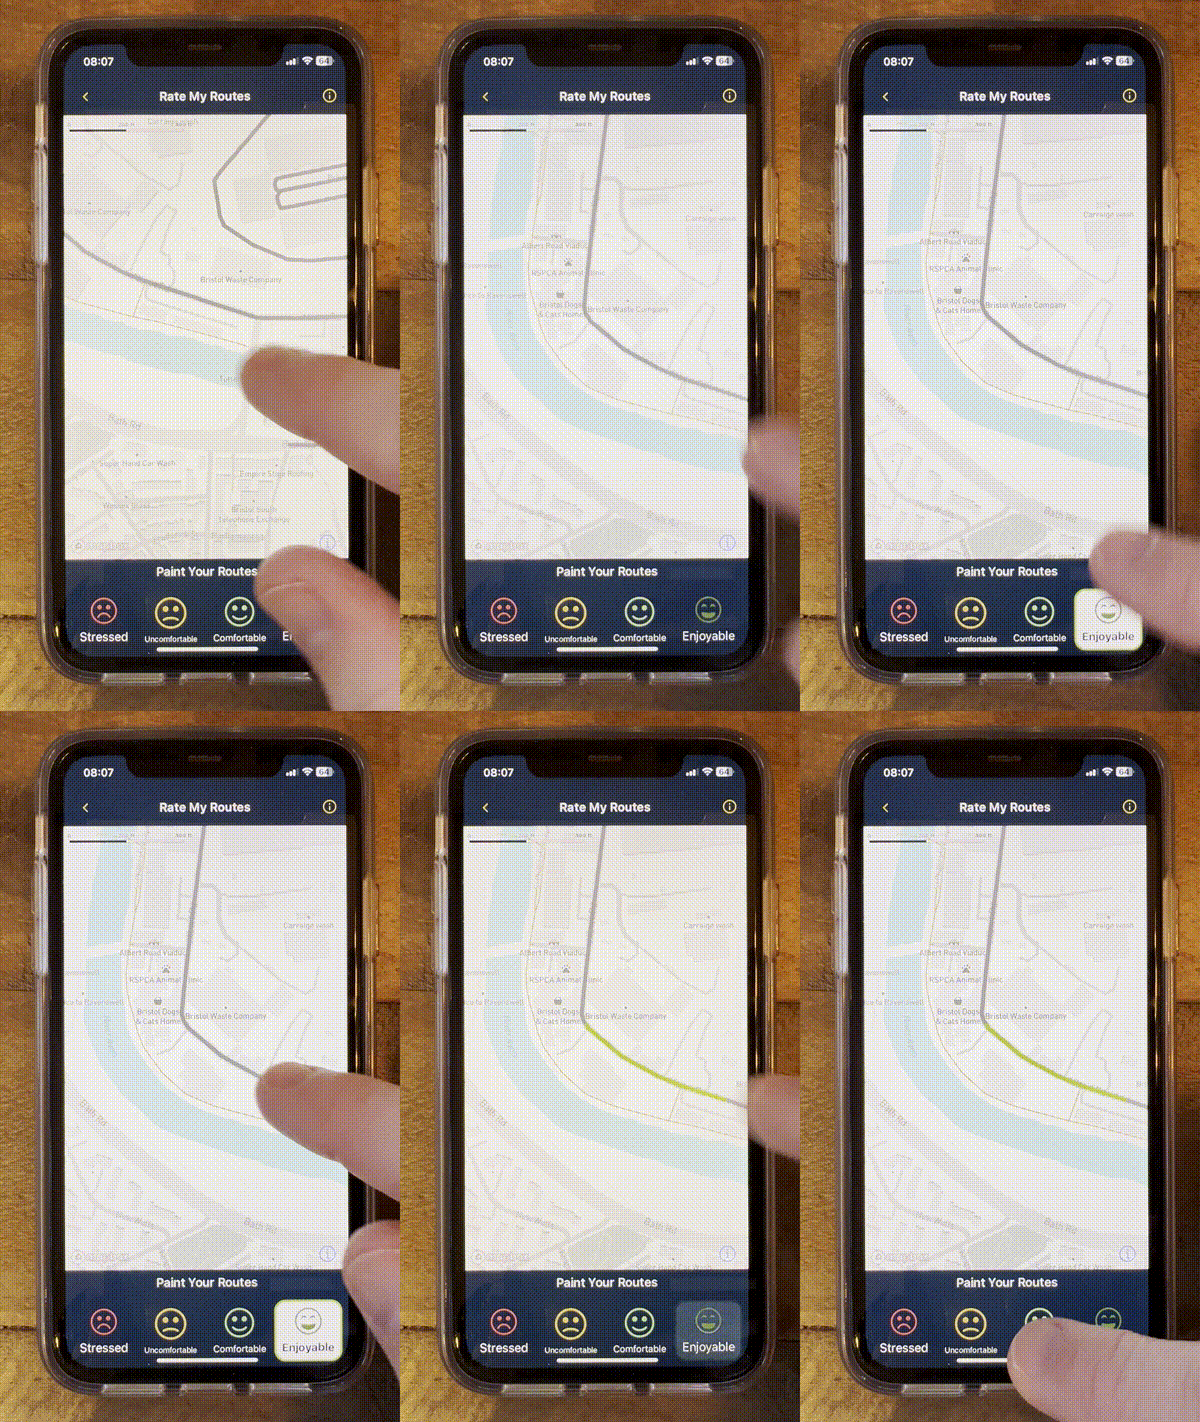
See how easy it is for people to give feedback
Rider safety and comfort data from your community
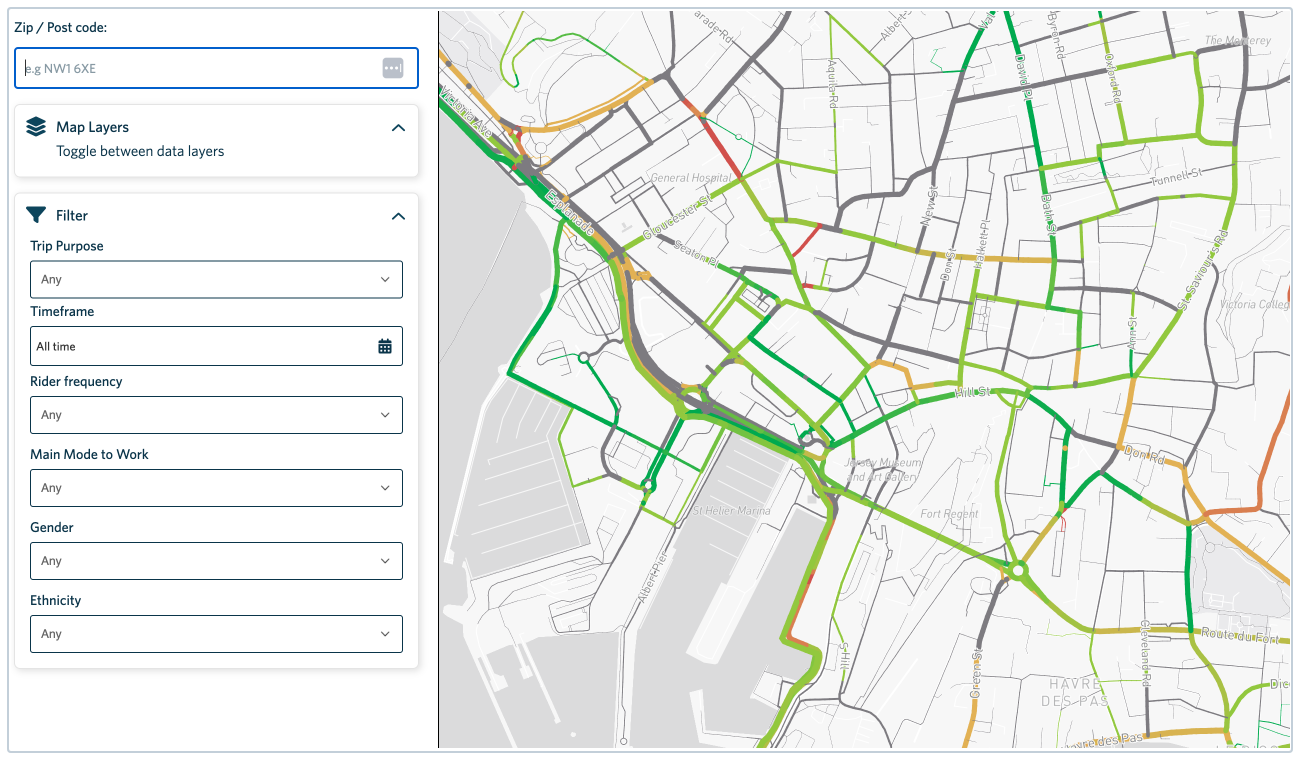
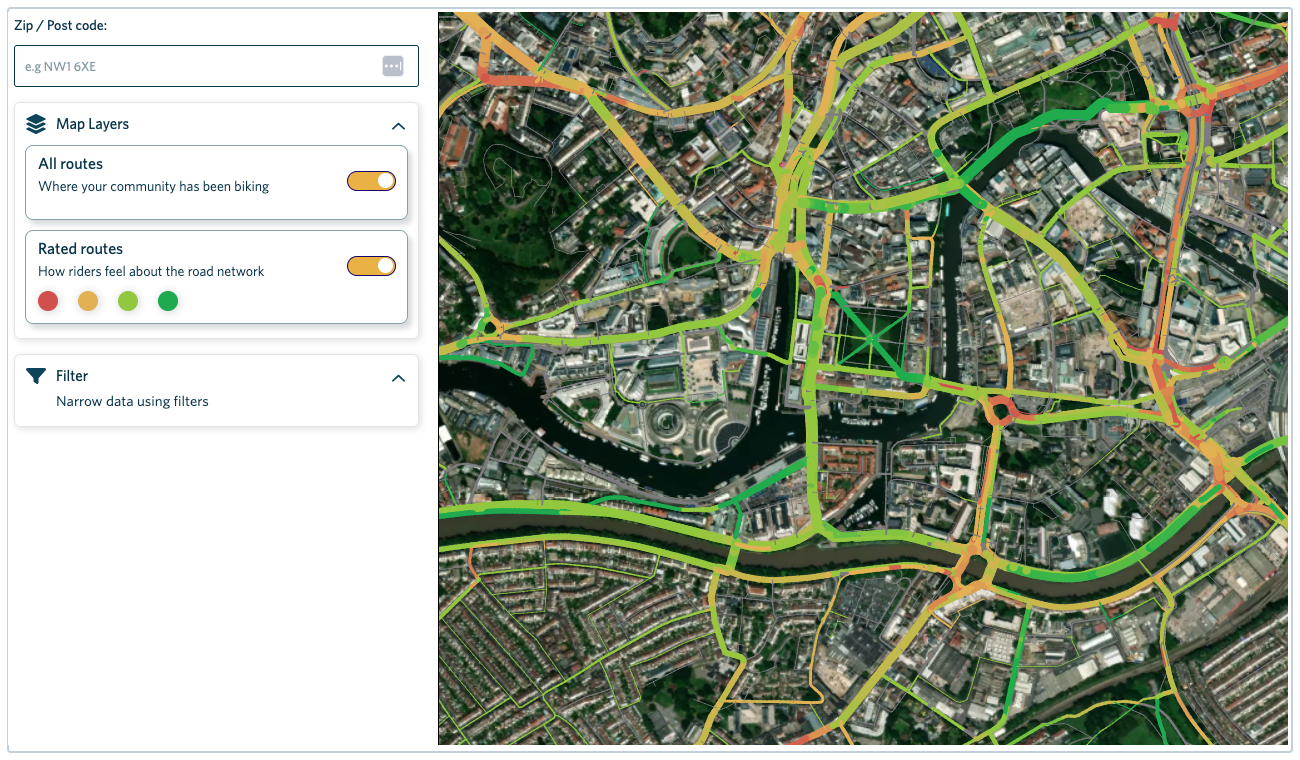
We aggregate your riders' road stress/comfort feedback and provide you with mapped views of your network.
The maps show how safe and comfortable your riders feel when navigating your local network by bike (down to 10-meter segments).
You can filter this data to show how safe different groups of people feel when biking on each street, for example:
- People who ride recreationally, but not yet for transportation
- Women who are new to riding
- People who live in specific neighbourhoods
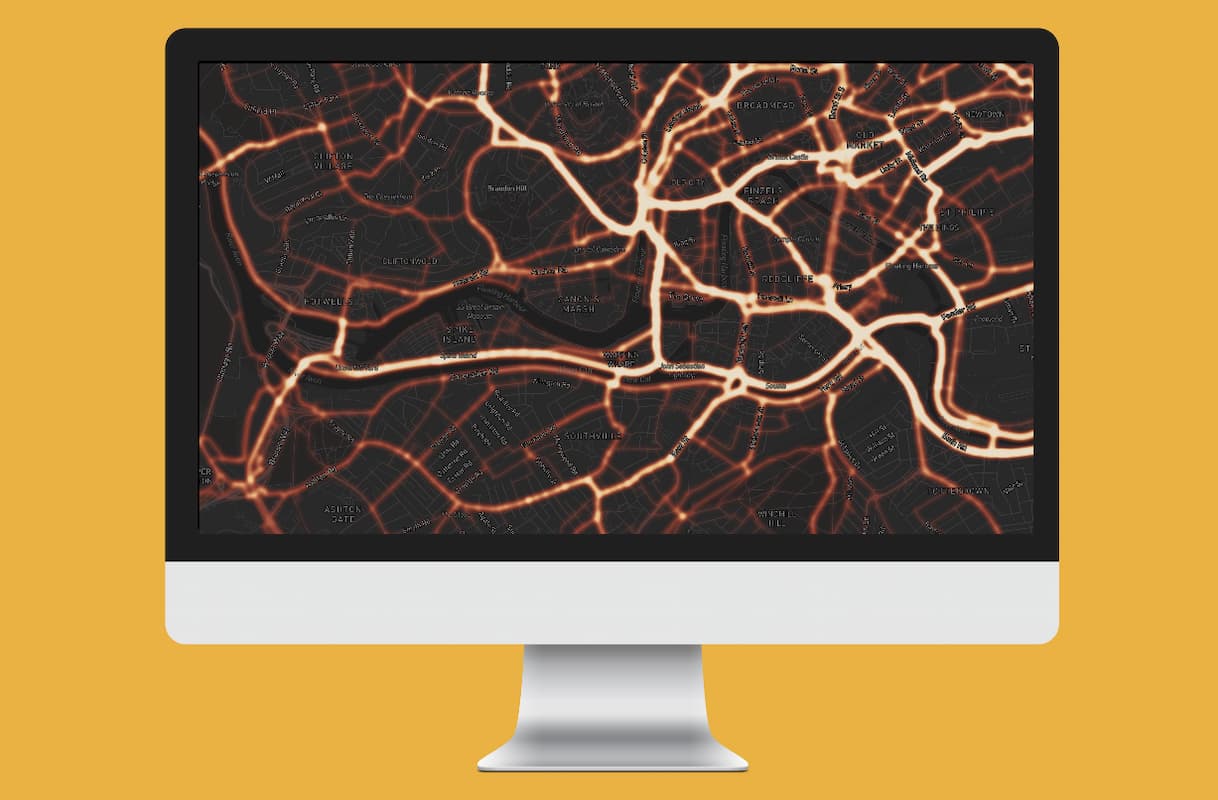
Quickly understand ridership volume and popular routes
See which routes people in your area are riding to get from A to B.
Combine trip volume data with comfort rating data and see which parts of your network are both well used, and rated as unsafe/uncomfortable.
This helps you quickly identify what parts of the network you can prioritise for improvements and where you’re likely to get a good ROI.
Get specific incident and
infrastructure feedback
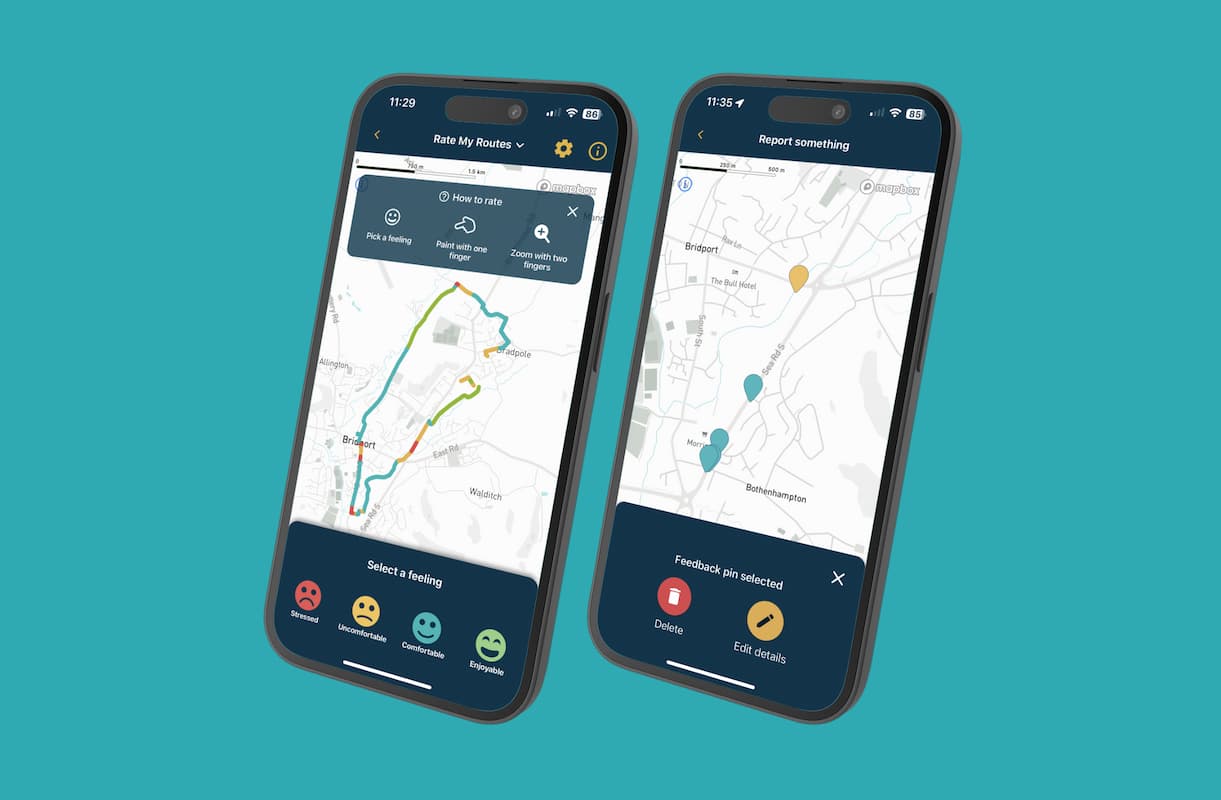
People can also drop a pin on the map and give specific feedback on places and reasons they feel safe/unsafe.
These include:
- Bike crashes / Near misses
- Road surface issues / Transitions
- Obstacles / Barriers
- Experiences with other vehicles
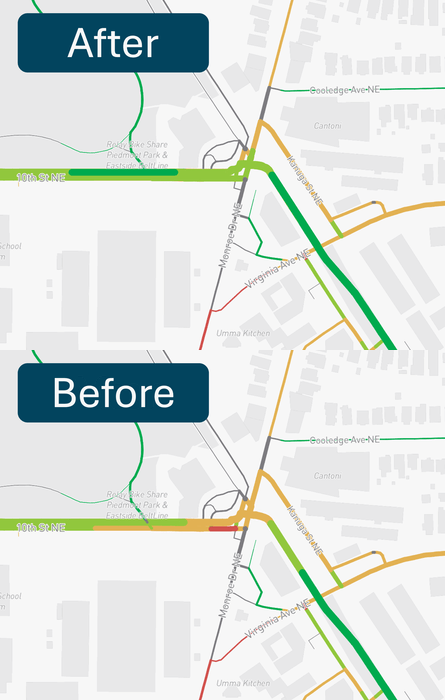
Measure your impact over time
Now, you can measure and evaluate the real impact of your efforts to improve safety and comfort in your community.
We provide route safety and LTS data for your local network, showing how conditions have changed over time.
This allows you to visually demonstrate the measurable improvements your projects are delivering, backed by data from community members.
Make a compelling case
We provide you with data and analysis tools that can help you to make the case for a project to key stakeholders, including:
- Local residents
- Local businesses
- Elected officials
- Your colleagues
Make your job easier with real data from local residents who use the streets you want to improve.

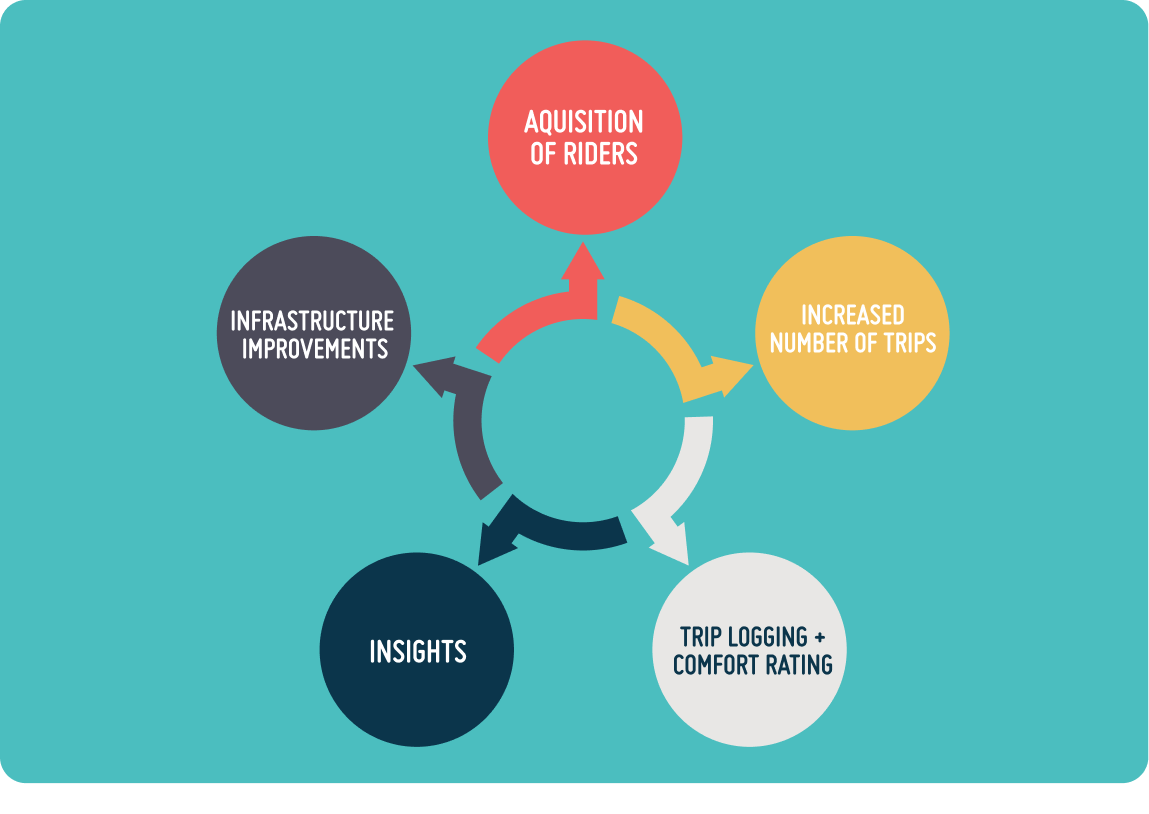
We’ve invested millions in biking data acquisition and analysis tools so you don’t have to!
When it comes to build-or-buy, Love to Ride makes the decision easy!
Our planning tools have been designed in close consultation with transportation and urban planning professionals and are ready to deploy to your region today.
About Love to Ride
Love to Ride provides the active transportation industry with the data and digital tools needed to be effective and efficient with limited budgets. There’s no need to reinvent the wheel.
Work with Love to Ride and we’ll adapt the wheel to your area to get you real and measurable results. For more than a decade our platform, programmes and tools have helped transportation professionals to achieve their goals for mode shift, safety, and community engagement.
Interested in learning more?
Or contact us: hello@lovetoride.net
Keep up to date with Love to Ride
Be the first to know what we're writing about!